PORTLAND, Ore. — With fire season now underway, Oregon's electricity providers are using the methods they developed after a series of very active wildfire years to keep a close watch on weather conditions that could threaten to bring down energized power lines and start fires.
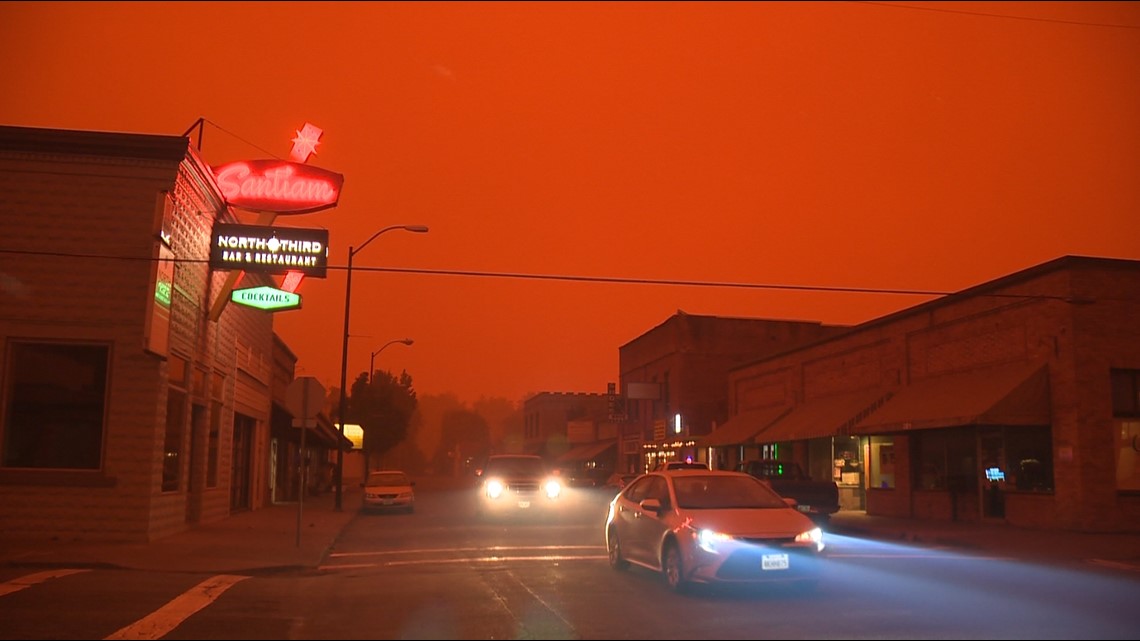
The summer of 2020 proved disastrous for thousands of Oregon homeowners — and by extension, the electric company Pacific Power. When powerful winds threatened over the long Labor Day weekend in September, the utility did not de-energize its lines in places like the Santiam Canyon.
Fires that broke out that weekend grew rapidly, giving wildland firefighters little time to respond. Between them, those fires damaged or destroyed 2,500 properties across Oregon.
Electrical equipment hasn't been blamed for all of the fires. The cause of the devastating Almeda fire in southern Oregon, for example, remains unknown, but is believed to have been "human caused." Other fires, especially in the Cascades, were initially sparked by lightning.
But at the same time, Pacific Power's transmission lines in particular were implicated in contributing to a number of fires throughout Oregon, as the windstorm downed trees onto energized lines.
A class action lawsuit against Pacific Power followed, and a jury recently awarded damages in the tens of millions of dollars to homeowners.


But even prior to the 2020 fires and the lawsuit, meteorologist Steve Vanderburg said that the company was talking to him about becoming their fire forecaster as they worked to build up expertise during a new age of Northwest wildfires. Now Vanderburg leads Pacific Power's fire weather team.
"We're prepared year-round," he told The Story's Pat Dooris. "We're running models 365 days a year. We're doing analysis, we're looking at vegetation conditions. So yeah, we're prepared for fire season."
The past informing the future
Vanderburg worked for the National Weather Service for 10 years, then for an electric company in San Diego for another 10 years. Now he's in Portland, and he spent the last year and a half building a massive database of historical fire information for Pacific Power.
It took supercomputers over a year to crunch the numbers, Vanderburg said, millions of computation hours.
That data doesn't just sit in spreadsheets. It can be turned into graphics, holding 30 years of high-resolution weather and vegetation conditions across the entire western U.S.
"And now we're analyzing it. We're looking at — how does that data inform what happens in terms of wildfire risk, in terms of different kinds of impacts on the grid," he said. "And we're using that to create products to keep us ahead of the weather."
The value of that, Vanderburg added, is that they can look at any location on the map and put today's weather or tomorrow's forecast into the context of the past 30 years.


Unlike their counterparts over at Portland General Electric, Pacific Power does not have an array of cameras equipped with artificial intelligence walking for telltale signs of smoke to show that a fire has begun. Instead, Vanderburg and his team rely on these databases, along with remote weather stations and workers in the field.
They cover a vast territory, across Oregon and five other states. Six states, all of them diverse in topography, with different weather conditions shaped by the territory.
"It's both a challenge but also an advantage, because when it comes to understanding how do you predict these things, the more data you have to work with, the better results you may get," Vanderburg said. "So from an analysis standpoint and trying to understand how do all these conditions impact fire danger, it's an advantage to have a large service territory. But obviously, forecasting on this scale can be challenging because the weather varies from canyon to canyon and mountain to mountain, and we have a lot of canyons and mountains in our service territory."
His team is creating forecasts for each state, every day. They look over all of the weather models they've developed, combine that with real-time data collection, then produce a forecast for the company that covers Pacific Power's entire service area.
In the red
To demonstrate how it all works, Vanderburg went back to data from last year, during a time in September 2022 when Pacific Power and PGE both initiated power shutoffs for thousands of customers as a windstorm threatened.
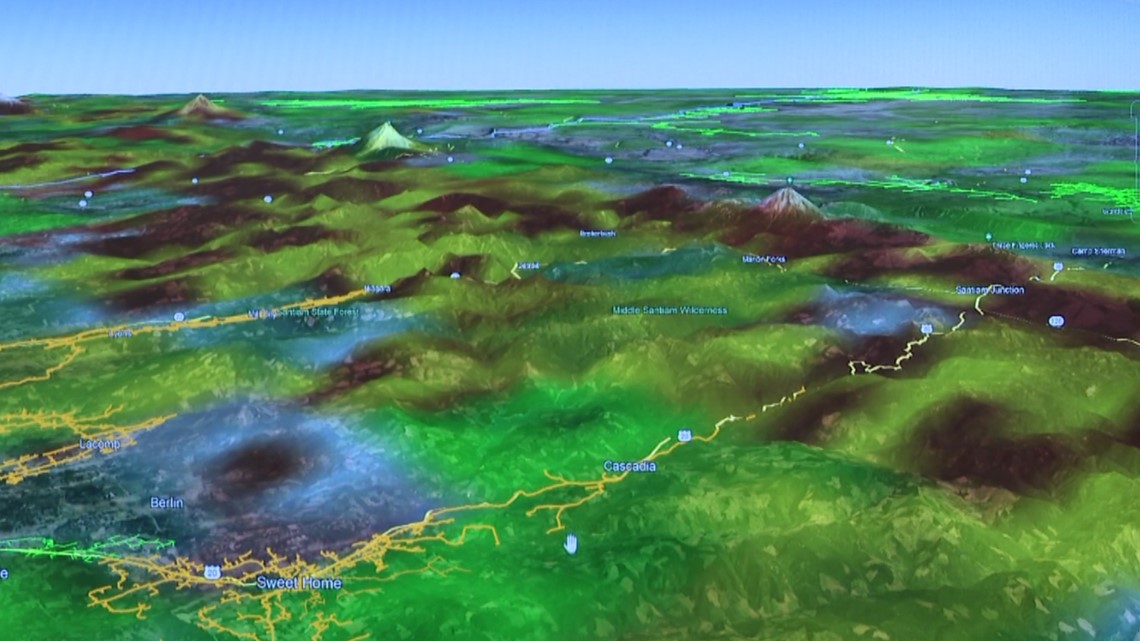
Vanderburg pulled up a map showing one danger area from back then, the town of Sweet Home southeast of Corvallis. On the map, yellow lines demonstrated where the power grid was located.
"So here we are on the night of (September 8)," he said. "The green indicates light winds. We're pretty much seeing light winds across the area, right? And as we scroll forward in time, you'll notice that we start to see all these reds showing up along the Cascade crest, and the yellows kind of spilling down the mountains."
Vanderburg explained that red on this map indicates winds over 50 miles per hour. Yellow is anywhere from 30 to 50, depending on the shade.
"And you can see as we go through the event, how those winds shift and change over time," he continued. "And you can see here, especially on the night of the 9th into the 10th, how those winds really start to try and channel down the west slopes of the Cascades, right? And so that's where we're seeing, you know, where the winds could impact our infrastructure."


When the winds are high, this means there's a higher probability of outages — downed power lines.
At the same time, Vanderburg's team is monitoring on a separate display how dry the area could be.
"You can see it's all red everywhere, right? Red's bad," Vanderburg said. "So what we're able to tell from this is like, when we look at fuel moisture, every place was dry. But where is it that we're going to focus our actions, you know, to mitigate that risk? And it's where we see this overlapping with the outage risk."
And that's why Pacific Power cut the electricity for Sweet Home at 12:40 a.m. on Sept. 9, 2022. The outage left 2,400 customers in the dark for 28 hours until the company deemed it safe to re-energize the lines.
Another tool that Vanderburg's team uses is forecast projections of winds, paired with an overlay of actual wind readings from weather stations.
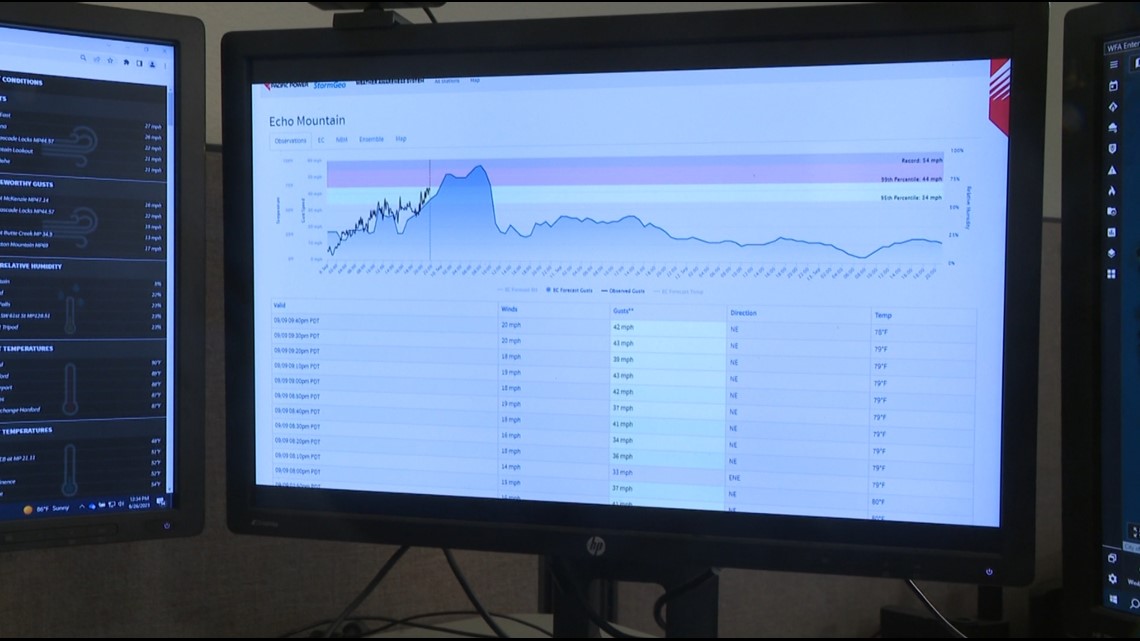
"This is the data we were pulling in at the time from Echo Mountain, which is just east of Lincoln City. And the black line represents the data we were getting from our weather stations every 10 minutes. And then the blue line represents a forecast of those conditions," he demonstrated.


"And you can see we're monitoring that, and now it's in the yellow and it's approaching the red," Vanderburg continued. "And this is when we're expecting the potential for those increased impacts to our power lines from those winds. So this is an example of the data that we can pull in, in real time, that gives us a look at, well, is it windier than forecast? Is it less windy? And how does that compare to what's normal for that location?"
The graph showed that a forecast of dangerous winds for this area was coming true, and so Pacific Power also shut off electricity there during the September 2022 windstorm.
Vanderburg said that the weather team's goal is to have most of the work done well before a storm hits. That allows time for the utility to put workers in place and warn the local community that the power may be shut off.
His team also runs fire simulations to see, if a fire broke out today, what would happen in a specific area.
"In this case I happen to be looking at flame length ... and here's a forecast going from Monday the 26th through Wednesday the 28th — and I can step through in time and we can see how does that change, power line by power line."
There are other models, like one showing the fire potential index for the greater Portland area. The biggest spike, by far, in the data history came in September 2020, when those disastrous wildfires tore through the state. It's one more tool that Pacific Power will use again this summer when deciding whether to turn off power ahead of a potential fire storm.
"All of this data really takes the guesswork out of it, it's really important to know not just what the weather's gonna do, but how that's going to impact the power lines and what does that mean in terms of the probability of something bad happening — that's really important," Vanderburg said. "And this is what these tools do. They don't just tell us what the forecast is and how windy and hot and dry it's gonna be, or how dry the vegetation's gonna be. It tells us what the potential probability of an outage is, the probability of an ignition occurring and the potential consequences of that ignition should it become a wildfire."

