PORTLAND, Oregon — Fifteen Oregon counties are going back into the extreme COVID-19 risk level on Friday. So, what are the metrics used to decide that? Oregon health leaders look to a few data points.
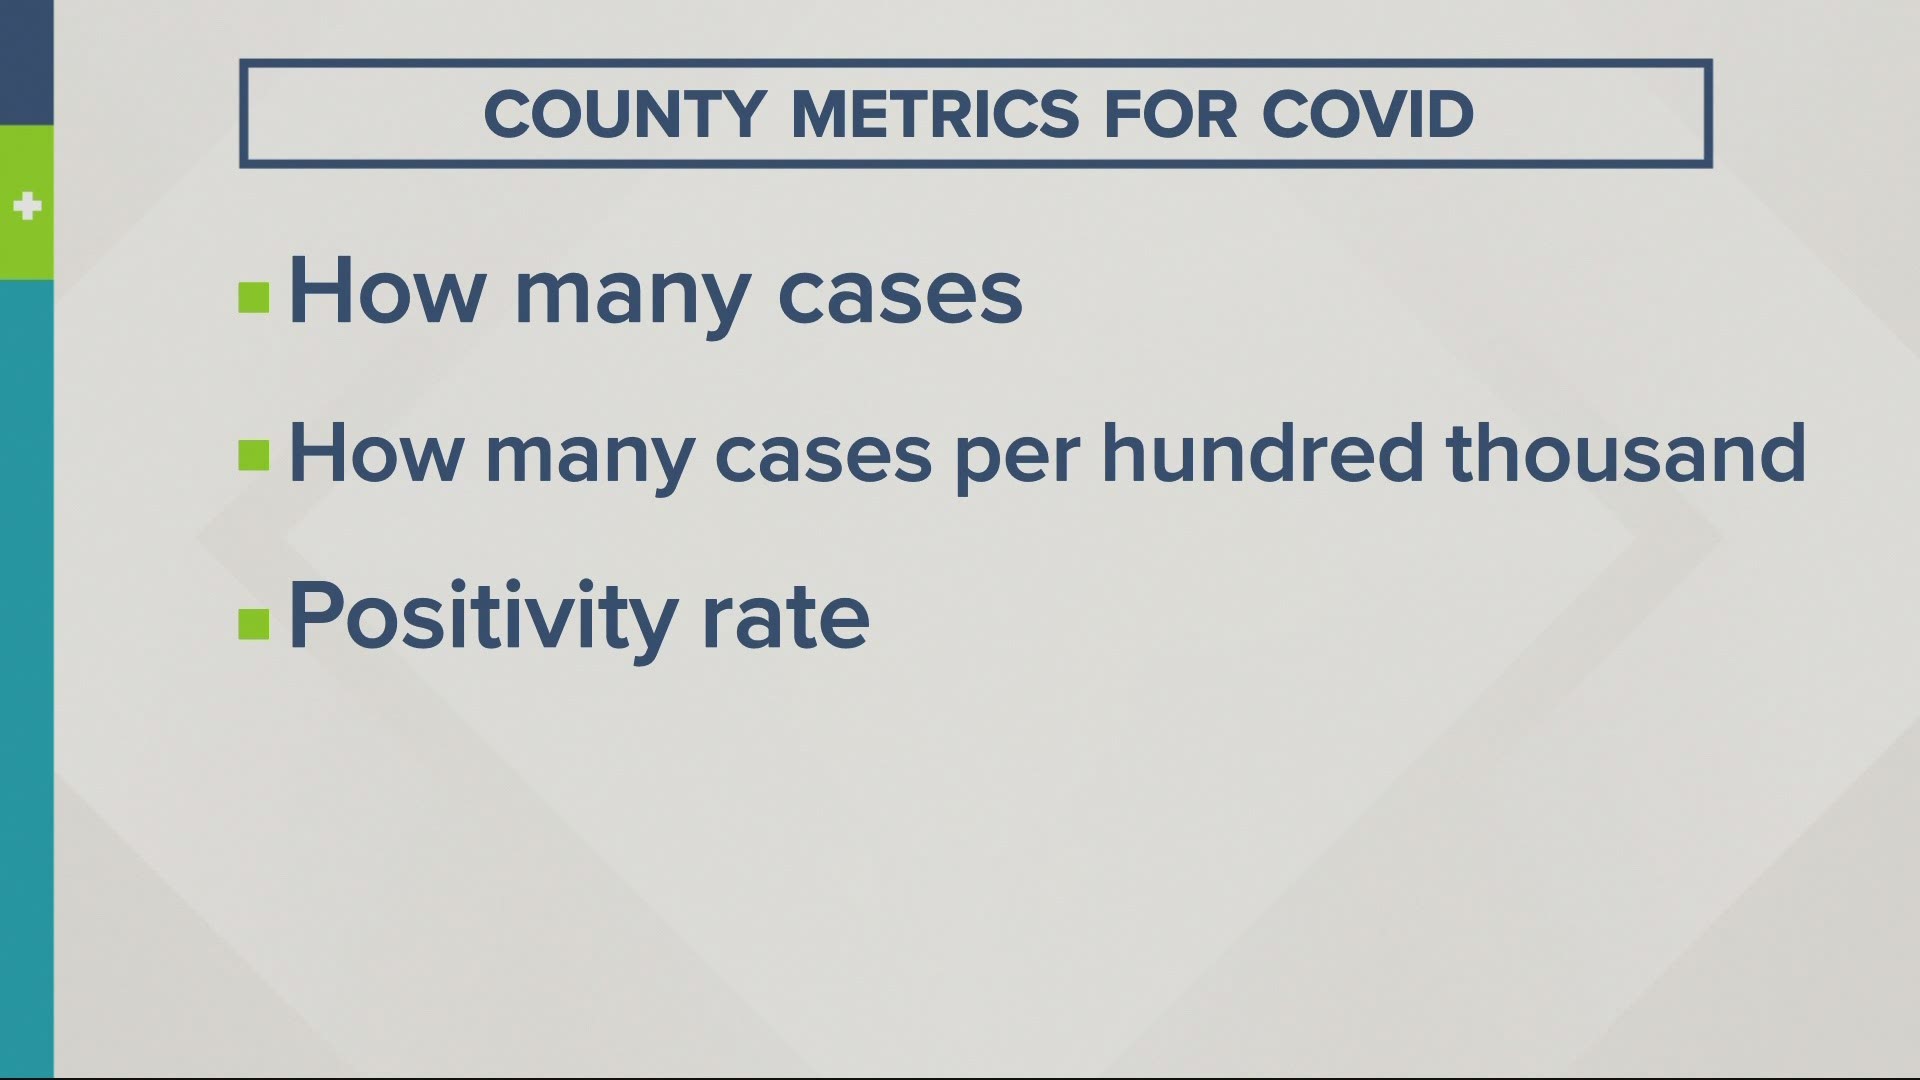
First, they want to know at the county level how many new cases of COVID-19 were reported over the last two weeks. They also look at the number of cases per 100,000 people so that the number can be compared to others around the state and even the nation.
And they also look at how many COVID tests come back positive in each county. It's called the positivity rate.
Having 200 cases per 100,000 people or a positivity rate of 10% or more could push any county into the extreme risk category, which brings the most restrictions out of the state's four risk levels.
In Marion County, the numbers for the two weeks from April 11 to April 24 include 1,041 new cases, with 299 cases per 100,000 people and a test positivity rate of 8.8%.
Marion County Commissioner Colm Willis thinks those numbers distort reality.
“The governor’s been using these political labels like 'extreme risk,' and I think these labels are misleading and inaccurate to the actual situation on the ground,” Willis said.
He's one of many frustrated by the governor's new orders.
“Over the last two weeks in Marion county, just over 1,000 people tested positive for COVID. That is less than one half of one percent of our population,” he said.
Marion County's population is 347,818 according to the U.S. Census Bureau.
“And I think when people hear 'extreme risk,' it makes them think, 'gosh, 10% of our population was infected in the last two weeks or 20%.' But it’s not. Its four-tenths of one percent of our population tested positive for COVID,” Willis said.
Others point to the New York Times COVID tracker project that allows you to see coronavirus hot spots, and Oregon does not look that bad. It also allows you to compare new cases per 100,000 people on a daily basis. Oregon has 20 and Colorado has 30.
But unlike Oregon, Colorado is opening up its restaurants, dropping most state rules and allowing local counties to impose restrictions. Last week, 28 counties said they would impose none.
Oregon's state epidemiologist Dean Sidelinger told state lawmakers only about 3% of COVID cases come from restaurants, and he said most happen with people and children who are not vaccinated.
Oregon Gov. Kate Brown also said counties will not move into extreme risk unless two criteria are met statewide: 300 or more COVID patients in hospital beds and a rise in cases week over week of at least 15%. As of Wednesday, both metrics were met.
Back at the county level, Multnomah County's numbers for the last two weeks include 1,818 cases, along with 221 cases per 100,000 people
and a 4.8% positivity rate.
Many like commissioner Colm Willis argue that's not nearly enough to shut down indoor dining and severely limit other business.
"The question is, is your community as a whole really in danger from this disease? Is the system failing? And the answer to those questions is no,” Willis said.
Visit the Oregon Health Authority's website for more information about Oregon's county risk level metrics.
Have a comment or story idea for Pat Dooris? Email him at pdooris@kgw.com

