PORTLAND, Oregon — Public health doctors and researchers studying the COVID pandemic in Oregon have noticed a trend to the infections.
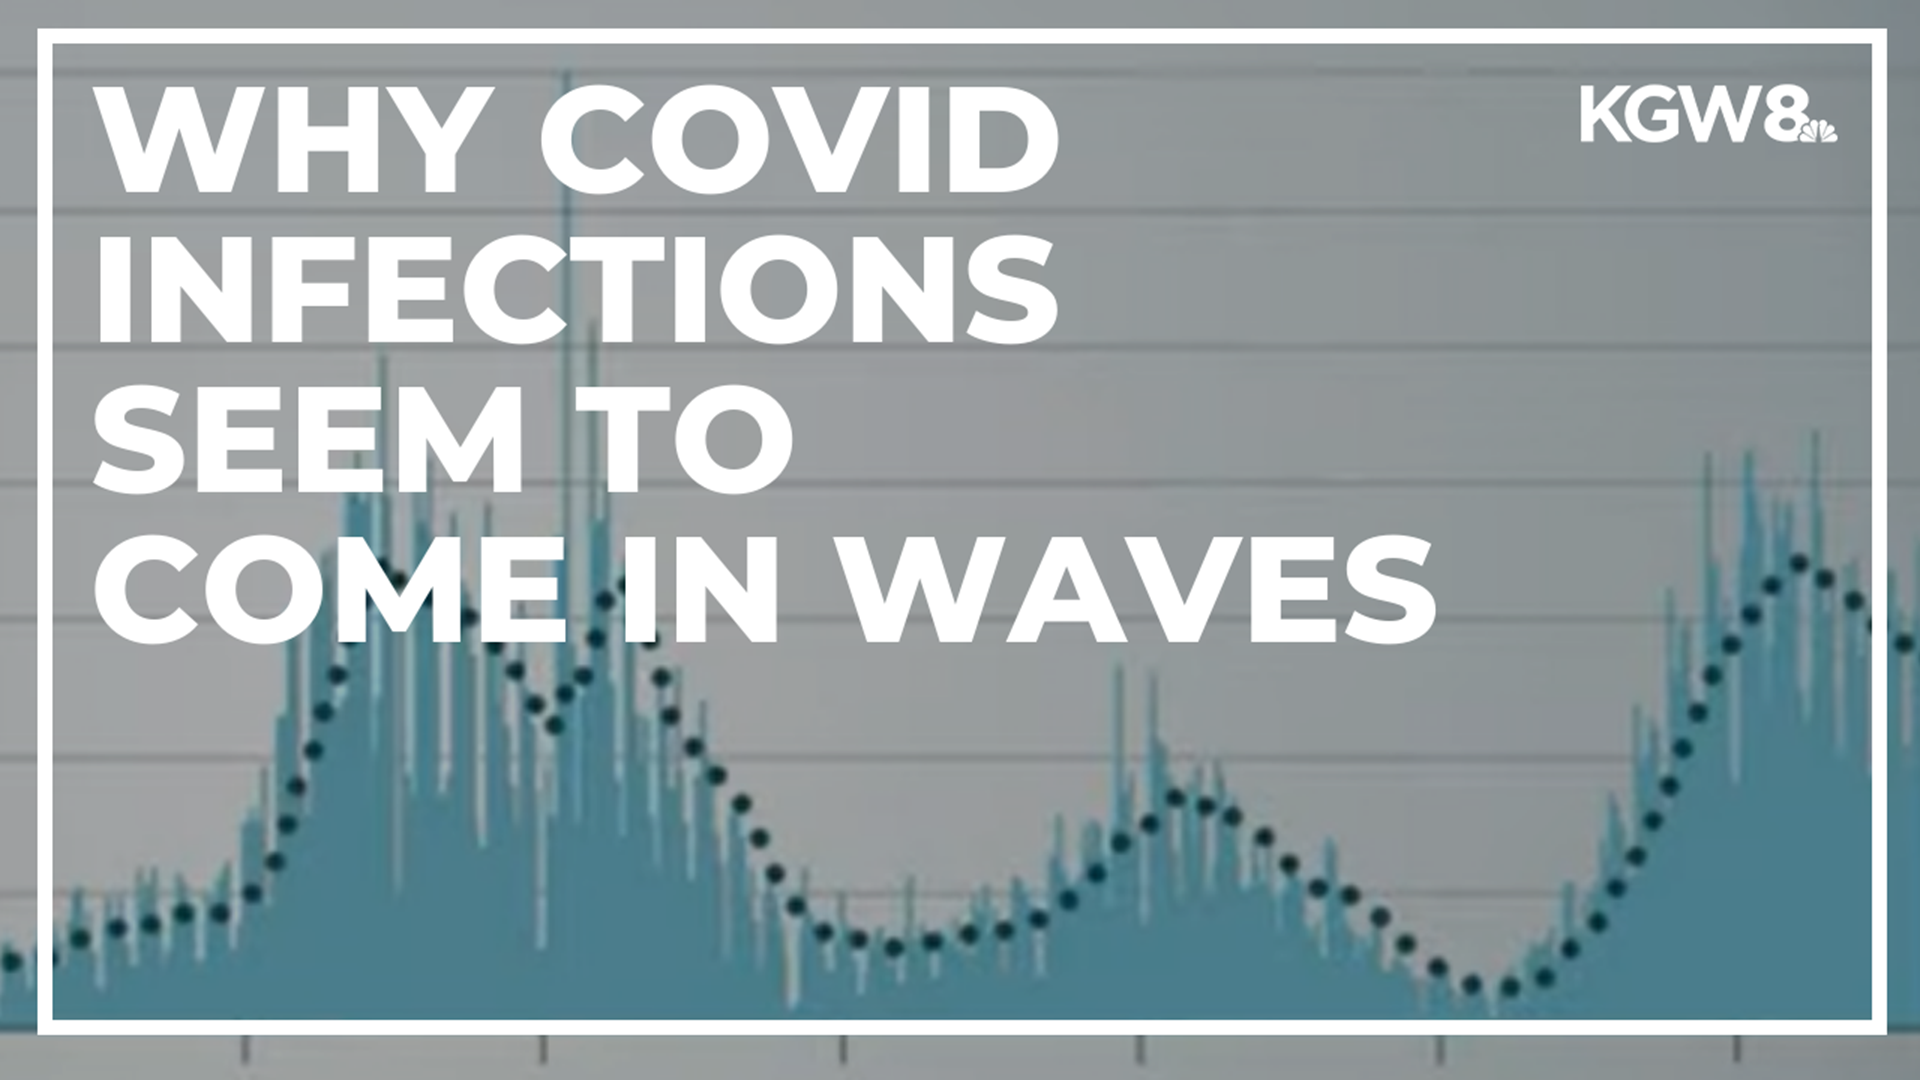
They seem to come in waves: infections ramp up for three months, then decline, before ramping up again.
“I’ve been modelling that pattern since quite early in the pandemic and I call it the fear and fatigue cycle,” said Oregon Health and Science University Data Scientist Peter Graven.
He believes it is most likely people and not the virus creating the waves.
He said as infections go up and word spreads, many start to take precautions and are more careful. Then as things get better and infection rates go down, people tend to relax a bit and start to gather as they used to before the pandemic, which starts the cycle all over again.
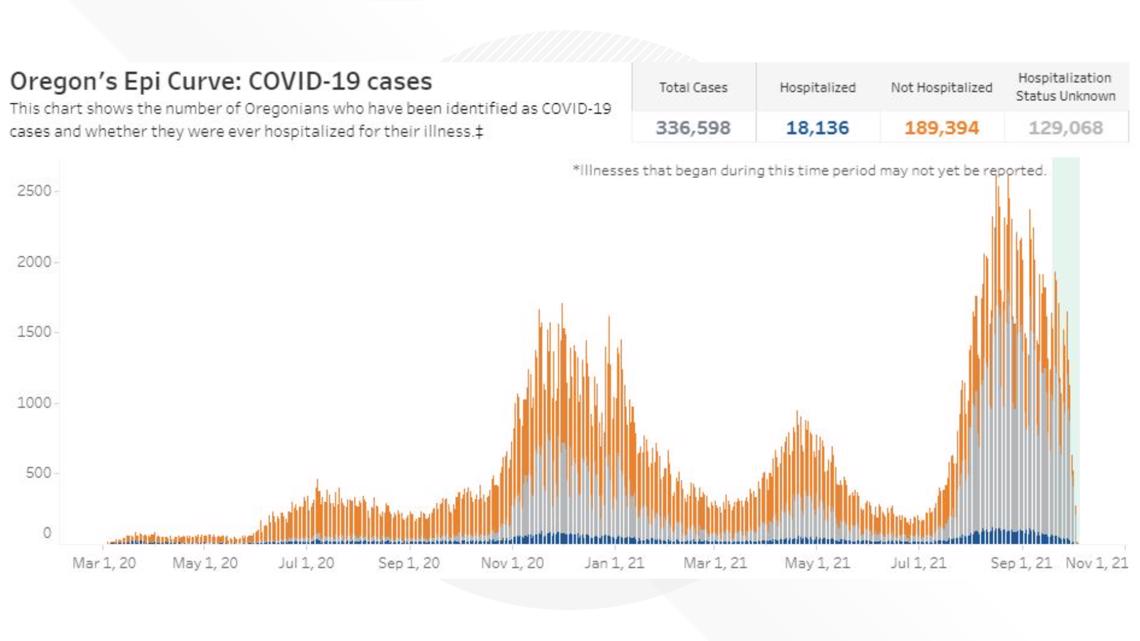
The cycles can be seen on the Oregon Health Authority's dashboard, where an epi curve chart shows the infections since March of 2020.


One cycle began in late October of 2020 — then was on its way down back down by late January. Another began building in late March of 2021, then was on the way down in late June.
Oregon is currently experiencing the back end of another wave that began in mid-July and is now on the way down again three months later in October.
“It’s been really interesting,” said Graven. “There have been times even before any policies happen, just through news reporting and other people seeing the case counts, people’s behavior will change.”
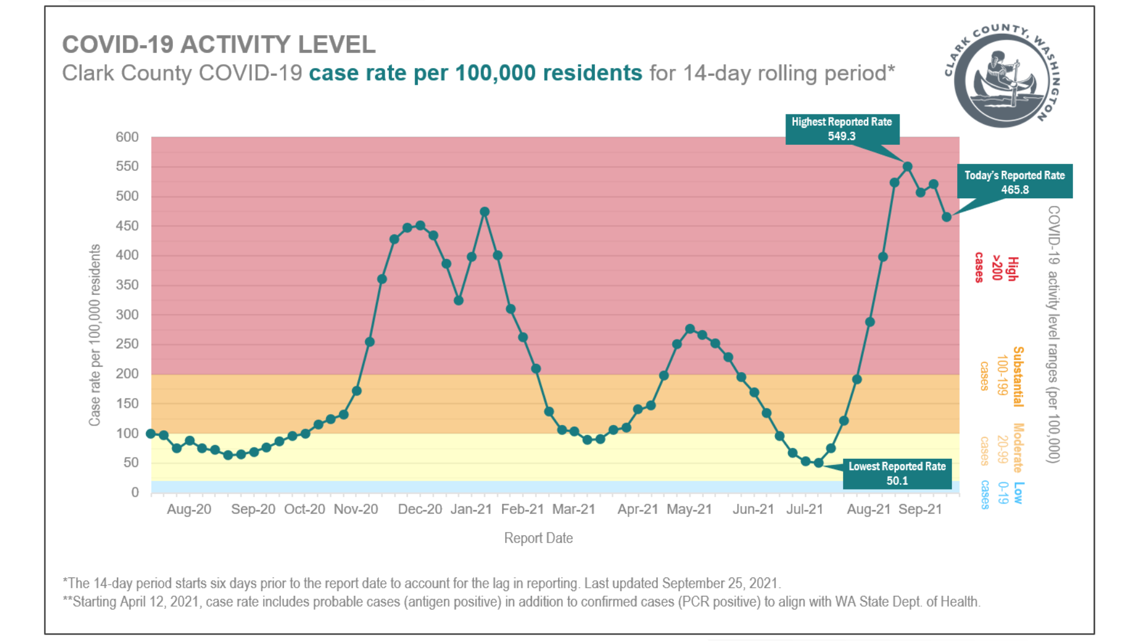
The same kind of waves can been seen in Clark County.


The number of cases per 100,000 people shows the pandemic building in November of 2020 then falling two months later in January of 2021. Then it builds again in April before falling two months later in June. The numbers climb one more time in August before starting to fall two months later in October.
“There does seem to be an ebb and a flow,” said Dr. Steven Krager, deputy health officer for Clark County.
He believes a number of factors are at play creating the waves, but a big question he cannot answer is where it goes from here.
It’s unclear because a lot of people in Clark County are still at risk, he said.
“You know 300,000 people in Clark County have some sort of immunity, that means 200,000 people may not," he added. "And that – to me that explains a lot of why we’ve continued to see large waves. There’s still a large susceptible population. People who can still get infected."
In Oregon, data scientist Peter Graven thinks it is possible we've seen the last big COVID wave until our immunity begins to wear off. Without boosters, we could potentially see another wave.
Have a comment or story idea for reporter Pat Dooris? Email him at pdooris@kgw.com

